An easy way to get some traffic statistics of your router/ firewall/ switches and all the other stuff that supports snmp is the utility mrtg.
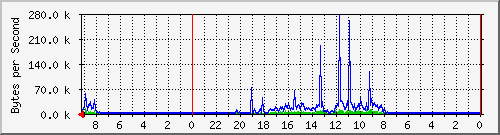
It helps you to find out quickly if more traffic than usual is passing your line. So you can interact fast if something suspicious is going on…
Whether your hardware supports snmp can be found out using the command:
snmpwalk -v 2c -c public 10.0.0.1 | less
-v = version (2c)
-c = community-password (public)
-ip = ip address of your hardware (10.0.0.1)
Don’t care too much about the output – it’s enough for the beginning if there is some at all…
1)
In the first step we’re generating a basic config (can be done by hand, but that’s rough work):
cfgmaker -global 'WorkDir: /srv/www/htdocs/mrtg' \

--output=/etc/mrtg.cfg public@10.0.0.1 public@10.0.0.2
WorkDir: output directory for the graphs
–output: target configuration file
public@10.0.0.1: first router
public@10.0.0.2: second router / switch / whatever
2)
With the following command you can create some basic web pages:
indexmaker -output=/srv/www/htdocs/mrtg/index.html \

-title="My Title" /etc/mrtg.cfg
-output: target index file
-title: title of the web page
/etc/mrtg.cfg: path to configuration file
3)
To get your statistics updated automatically, insert a cronjob like this:
*/5 * * * * env LANG=C /usr/bin/mrtg /etc/mrtg.cfg \

--logging=/var/log/mrtg.log