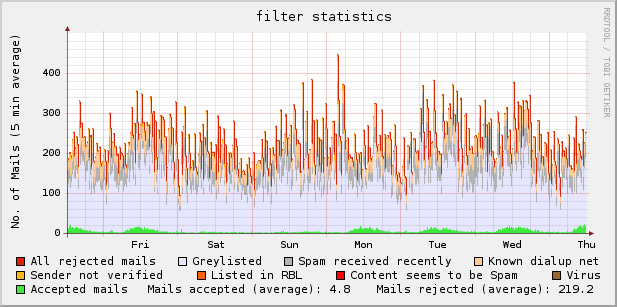
Because I did not found a tool to create graphs (the way I want it)
from exim logs, I wrote a little bash script that suits my needs.
Example graph:

Download: exim_rrd-0.9.5.1 (updated 2009-03-07 [bugfix])
I’m not a programmer, so the script can be improved – no question : )
If you have any hints, please tell me.
Usage: run as cronjob, i.e.
# mail statistic

*/5 * * * * /usr/local/bin/exim_rrd > /dev/null 2> /dev/null
dependencies:
rrdtool [ http://oss.oetiker.ch/rrdtool/ ] ^ thanks to Tobias Oetiker
(e)grep
– – – – – – – – – – – – – – – – – – – – – – – – – – – – – – – – – – – – – – – – – – – – –
tested with:
rrdtool 1.2.23, rrdtool 1.2.27
openSUSE 10.3 (i586), exim 4.69 main log
openSUSE 11.0 (i586), exim 4.69 main log
4 thoughts on “exim graphs”
Comments are closed.
Very good, and quite simple/clean to read.
A job well done!
hi there,
just tested this script with postfix on an old suse 10.2 (sic!); worked so far
except some minor changes:
line:55 >= this works only with the trailing |
## delete the last character (the last | isn’t wanted)
#SEARCH=`echo $e | sed ‘s/.$//’`
i also made some modificatiosn for the filters to fit for postfix/rbl_rejects:
# ALL accepted mails
# might be too: “delivered to mailbox”
ACCEPTED=`echo “$CONTENT” | grep ” status=sent ” | wc -l`
#
# ALL blocked mails
REJECTED=`echo “$CONTENT” | grep ” reject:” | wc -l`
nice script, though
mex
Thanks – not exactly what I wanted (per user stats) but it’s a start!