Because I did not found a tool to create graphs (the way I want it)
from exim logs, I wrote a little bash script that suits my needs.
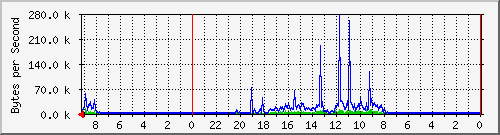
Example graph:

Download: exim_rrd-0.9.5.1 (updated 2009-03-07 [bugfix])
I’m not a programmer, so the script can be improved – no question : )
If you have any hints, please tell me.
Usage: run as cronjob, i.e.
# mail statistic

*/5 * * * * /usr/local/bin/exim_rrd > /dev/null 2> /dev/null
dependencies:
rrdtool [ http://oss.oetiker.ch/rrdtool/ ] ^ thanks to Tobias Oetiker
(e)grep
– – – – – – – – – – – – – – – – – – – – – – – – – – – – – – – – – – – – – – – – – – – – –
tested with:
rrdtool 1.2.23, rrdtool 1.2.27
openSUSE 10.3 (i586), exim 4.69 main log
openSUSE 11.0 (i586), exim 4.69 main log
Category Archives: Monitoring
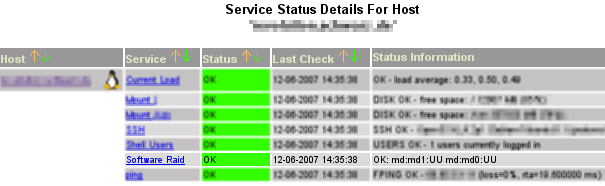
Monitoring Software Raid Devices with Nagios 2.x
Just found a plugin to monitor the status of software raid devices. Other raid devices like megaide, megaraid, etc. are supported, too. Thanks a lot to Steve Shipway for providing this great tool.
Supported devices:
Version 1.1: IPS; Solaris, AIX, Linux software RAID; megaide
Version 2.0: Added megaraid, mpt (serveraid), aacli (serveraid)
Download here or from the guys at NagiosExchange.
Statistics of tom’s blog …
 Windows: 73,7 %
 Linux: 17,3 %
 Mac: 5,4 %
 Others: 3,6 %
 Firefox: 62 %
 M$ IE: 30,1 %
 Safari: 2 %
 Opera: 1,4 %
Using multiple logiles in one awstats config
With awstats you can create great statistics and graphs about the access of your website. If you want to use more than one logfile in a configuration file, you can use logresolvemerge.pl which is included in the awstats package.
i.e.:
LogFile="/path2/awstats/tools/logresolvemerge.pl /var/log/apache/access_log /var/log/apache/another_log |"
Test your configuration:
/path2/awstats.pl -config=sitename -update
Nagios 2.x Plugin check_mrtgtraf buggy?
affected:
…
nagios plugins 1.4.3
nagios plugins 1.4.5
nagios plugins 1.4.6 (Feb, 05 – 2007)
I was trying to implement the check_mrtgtraf plugin for nagios.
A test run in bash using the command
./check_mrtgtraf -F /my/mrtg/log/server.log -w "196608,196608" -c "235929,235929"
resulted in the following “error”:
Traffic UNKNOWN – Avg. In = 2.3 KB/s, Avg. Out = 2.3 KB/s ..
In my constellation the result should be “Traffic OK”, because the limit of 0,19 MByte/s (1,5 MBit) has not been reached. On http://archive.netbsd.se I found a hint from Israel Brewster that fixed it:
From: Israel Brewster
Date: 2007-01-26 17:54:06
—
I’m pretty sure this is a bug. I ran into the same thing, but was able to fix it easily enough in the source code. Looking at the original code for this plugin, you can find the section where it sets the output state, something like:
if (incoming_rate > incoming_critical_threshold
|| outgoing_rate >
outgoing_critical_threshold) {
result = STATE_CRITICAL;
}
else if (incoming_rate > incoming_warning_threshold
|| outgoing_rate >
outgoing_warning_threshold) {
result = STATE_WARNING;
}
This may not be exact, as I have modified the code somewhat, but I think it is pretty close, if not. At any rate, what you’ll notice is that while the result is set to STATE_CRITICAL or STATE_WARNING, depending on the circumstances, it is never set to STATE_OK (as you mentioned in your original message), which means that it remains in its STATE_UNKNOWN default state if the traffic is OK, to fix it, all you need to do is add the two lines:
else
result = STATE_OK;
Immediately following the closing bracket on the code block above, and recompile. At least, that fixed it for me. I have plugins version 1.4.3, I don’t know if this issue has been fixed in a newer version of the plugins or not (current is 1.4.5)
That workaround did it for me, too.
You can download my patched version of the c source right here: check_mrtgtraf.c – fixed version
Do you like statistics?
An easy way to get some traffic statistics of your router/ firewall/ switches and all the other stuff that supports snmp is the utility mrtg.
It helps you to find out quickly if more traffic than usual is passing your line. So you can interact fast if something suspicious is going on…
Whether your hardware supports snmp can be found out using the command:
snmpwalk -v 2c -c public 10.0.0.1 | less
-v = version (2c)
-c = community-password (public)
-ip = ip address of your hardware (10.0.0.1)
Don’t care too much about the output – it’s enough for the beginning if there is some at all…
1)
In the first step we’re generating a basic config (can be done by hand, but that’s rough work):
cfgmaker -global 'WorkDir: /srv/www/htdocs/mrtg' \

--output=/etc/mrtg.cfg public@10.0.0.1 public@10.0.0.2
WorkDir: output directory for the graphs
–output: target configuration file
public@10.0.0.1: first router
public@10.0.0.2: second router / switch / whatever
2)
With the following command you can create some basic web pages:
indexmaker -output=/srv/www/htdocs/mrtg/index.html \

-title="My Title" /etc/mrtg.cfg
-output: target index file
-title: title of the web page
/etc/mrtg.cfg: path to configuration file
3)
To get your statistics updated automatically, insert a cronjob like this:
*/5 * * * * env LANG=C /usr/bin/mrtg /etc/mrtg.cfg \

--logging=/var/log/mrtg.log